Laboratory at İstanbul Devlet Mühendislik ve Mimarlık Akademisi (1969-1982).
Laboratory at İstanbul Devlet Mühendislik ve Mimarlık Akademisi (1969-1982).This was published on our company engineering blog. To keep up with new writing, sign up for my (entirely inactive) newsletter.
For multi-tenant mixed-workload systems like CockroachDB, performance predictability and isolation are critical. Most forms of shared infrastructure approximate these properties, be it through physical isolation within data centers, virtualized resource limits, drastic over-provisioning, and more. For CockroachDB it’s not just protecting latencies across workload/tenant boundaries, it’s also about isolation from the system’s internal/elastic work like LSM compactions, MVCC garbage collection, and backups, and also from user-initiated bulk work like changefeed backfills.
For ill-considered reasons this is something they let me work on. Here we’ll describe generally applicable techniques we applied under the umbrella of admission control, how we arrived at them, and why they were effective. We’ll use control theory, study CPU scheduler latencies, build forms of cooperative scheduling, and patch the Go runtime. We hope for it to be relevant to most systems builders (and aspiring ones!), even if the problems motivating the work were found in this oddly-named database.
1. Capacity-unaware, static rate limiting
Backups in CockroachDB are scan dominant and therefore CPU-heavy; it operates over some specified keyspace, exporting the data as SSTs (helping speed up imports). It’s well understood that high CPU utilization can negatively affect tail latencies (for reasons this author didn’t previously get, and tried to below), to reduce impact of elastic work on latency-sensitive foreground work, we used statically configured rate limits per-node. This works ok-ish but default values were hard to pick given their dependence on provisioned capacity and observed load (dynamic over time). It’s easy to defeat such rate limiters in practice – below for example we see an unacceptable latency hit due to backups.
3-node 8vCPU cluster running TPC-C with 1000 warehouses and an aggressive backup schedule (incremental backups every 10m, full backups every 1h at the 45m mark), with the p99 latency impact shown.
Figure 1. 3-node 8vCPU cluster running TPC-C with 1000 warehouses and an aggressive backup schedule (incremental backups every 10m, full backups every 1h at the 45m mark), with the p99 latency impact shown.This problem is more general: any background operation that’s CPU-heavy (LSM compactions, MVCC GC, catchup scans) can adversely impact tail latencies.
2. Capturing latency outliers
After ruling out a few possible causes for latency impact unrelated to utilization (excess block cache misses for example, in case it wasn’t as scan resistant as imagined, or latch contention, or head-of-line blocking in RPC streams), we wanted to understand what exactly it was about high CPU use that resulted in tail latency impact – all we had thus far was unhelpful correlation.
With CPU sometimes high utilization is moderate over-utilization, but was this something we could observe directly? We already knew that lowering backup rate limits helped reduce foreground latency impact, but it wasn’t clear what signal we could use to do this automatically. Using foreground tail latencies in any control loop is untenable since it’s so workload dependent (contention, query sizes). Another problem was that adjusting the rate limiter in its current form was going be too coarse – we could see latency impact with just three backup requests running concurrently, so adjusting it up or down automatically could oscillate between periods of over-{utilization,admission} with latency impact, followed by under-{utilization,admission} with slower-than-necessary elastic work. To be work-conserving, we would need something more granular.
2.1 Runnable goroutines per processor
We first looked at a 1000hz sample of the average number of runnable goroutines (think ‘threads waiting to get scheduled’) per processor, hoping to find a large queue buildup. This high-frequency measure was being used already to detect signs of severe overload within admission control, at which point we shift queueing out of the scheduler into DB-managed queues where we can differentiate by priority, like treating internal heartbeat work with the highest priority or GC work with lower priority. Unfortunately this metric was low-and-varying despite high-but-stable foreground latencies.
Low-and-highly-varying runnable goroutines per-processor despite high-but-stable foreground latencies.
Figure 2. Low-and-highly-varying runnable goroutines per-processor despite high-but-stable foreground latencies.2.2 Probabilistic tracing and Go scheduler traces
Stumped by metrics and what we thought was a sensitive measure of scheduling latency, we shifted attention elsewhere. We turned to distributed traces, typically helpful with latency investigations. In these experiments we wanted to observe where latency was spent for long tail executions (think p99.9, p99.99) since lower percentiles were mostly unharmed.
Tracing has measurable overhead, especially for a high-throughput system such as ours. With traced executions we’re transferring additional bytes back and forth across RPC boundaries (even just trace metadata can be proportional in byte size to foreground requests/responses), not to mention the additional memory overhead from collecting trace data/logging itself. Tail-based sampling techniques are applicable but unhelpful, often concerned with the overhead of storing the trace data instead of the overhead of tracing itself. Earlier attempts within CockroachDB to get to “always-on tracing” fell flat due to this overhead, despite attempts to re-use tracing spans, limiting child spans, only lazily transferring trace data over the network, etc. Enabling tracing for all executions to capture a p99.99 trace can perturb the system under observation, through sheer stress, enough to no longer capture the trace of interest. It’s self-defeating in the funniest way.
Latency and throughput impact of always-on tracing. On the left we’re always tracing, on the right we aren’t. Yikes.
Figure 3. Latency and throughput impact of always-on tracing. On the left we’re always tracing, on the right we aren’t. Yikes.State-of-the-art kernel tracing techniques talk about bounding overhead to at
most 1% which inspired us to try
something trivial – tracing probabilistically. Since we were after high-tail
events for frequently occurring operations, we could always choose a
probability low enough to bound the aggregate overhead in the system while just
high enough to capture outlier traces within a reasonable time frame. This was
effective! In the example below we were running full backups at every 35m mark
on the hour, and incremental backups at every 10m mark (RECURRING '*/10 * * *
*' FULL BACKUP '35 * * * *') with latencies spiking during the backups. With
this machinery we were able to set up a “trap” over a 10h window to get just
the set of outlier traces we were looking for.
> SELECT crdb_internal.request_statement_bundle(
  'INSERT INTO new_order(no_o_id, ...)', -- stmt fingerprint
  0.01,                                  -- 1% sampling probability
  '30ms'::INTERVAL,                      -- 30ms target (p99.9)
  '10h'::INTERVAL                        -- capture window
);

> WITH histogram AS
     (SELECT extract('minute', collected_at) AS minute,
             count(*) FROM system.statement_diagnostics
      GROUP BY minute)
SELECT minute,
       repeat('*', (30 * count/(max(count) OVER ()))::INT8) AS freq
FROM histogram
ORDER BY count DESC;

  minute |              freq
---------+---------------------------------
      35 | *********************
      00 | *********************
      30 | ********************
      40 | *****************
      20 | **************
      10 | *************
      50 | ***********
(8 rows)
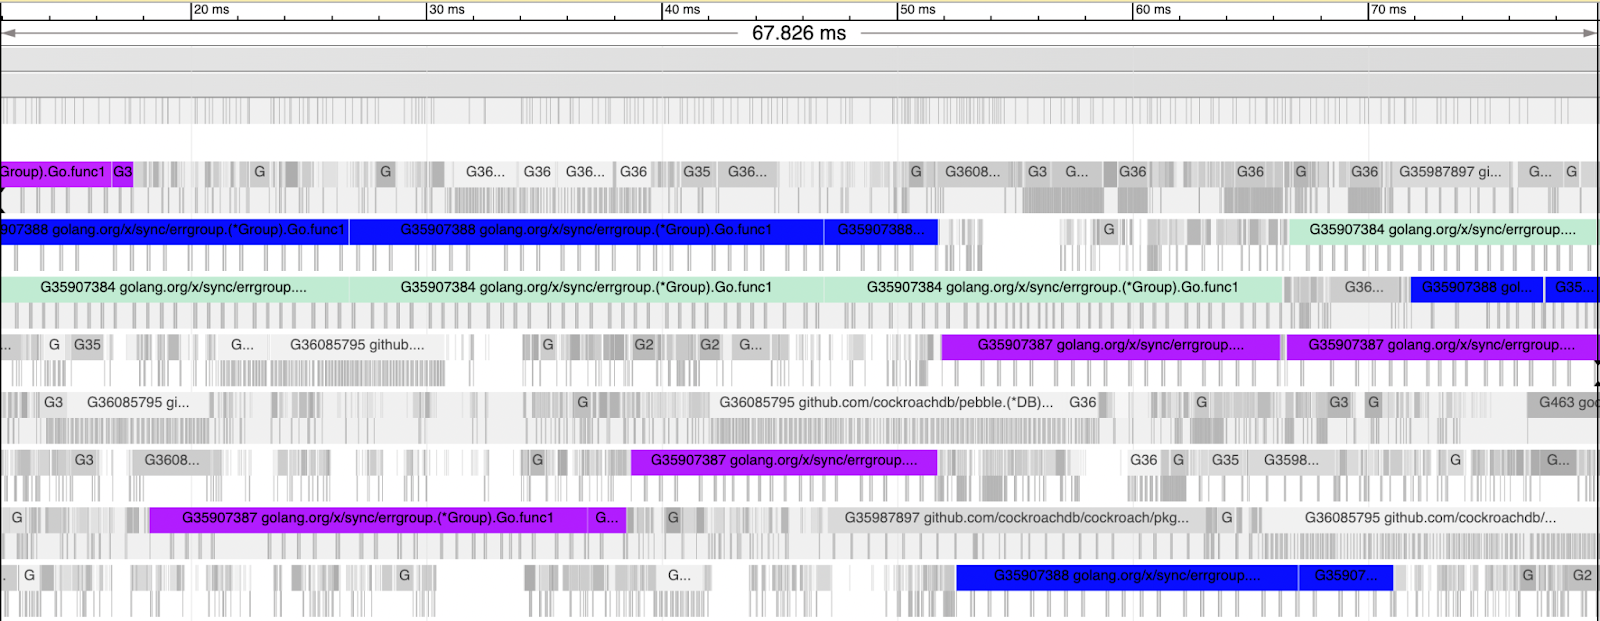
The traces revealed something interesting: most of the latency budget was spent across RPC boundaries. In the trace below we not only see the node receiving the RPC request takes time to actually start processing the RPC, but also the node receiving the response taking a non-trivial amount of time to actually handle the response. We had ruled out network effects through other means, but after observing that we were also straddling goroutine boundaries across RPC boundaries, we took another look at the scheduler.
Outlier trace showing how much of the latency budget is spent straddling RPC/goroutine boundaries.
Figure 4. Outlier trace showing how much of the latency budget is spent straddling RPC/goroutine boundaries.2.3 Another look at scheduling latency
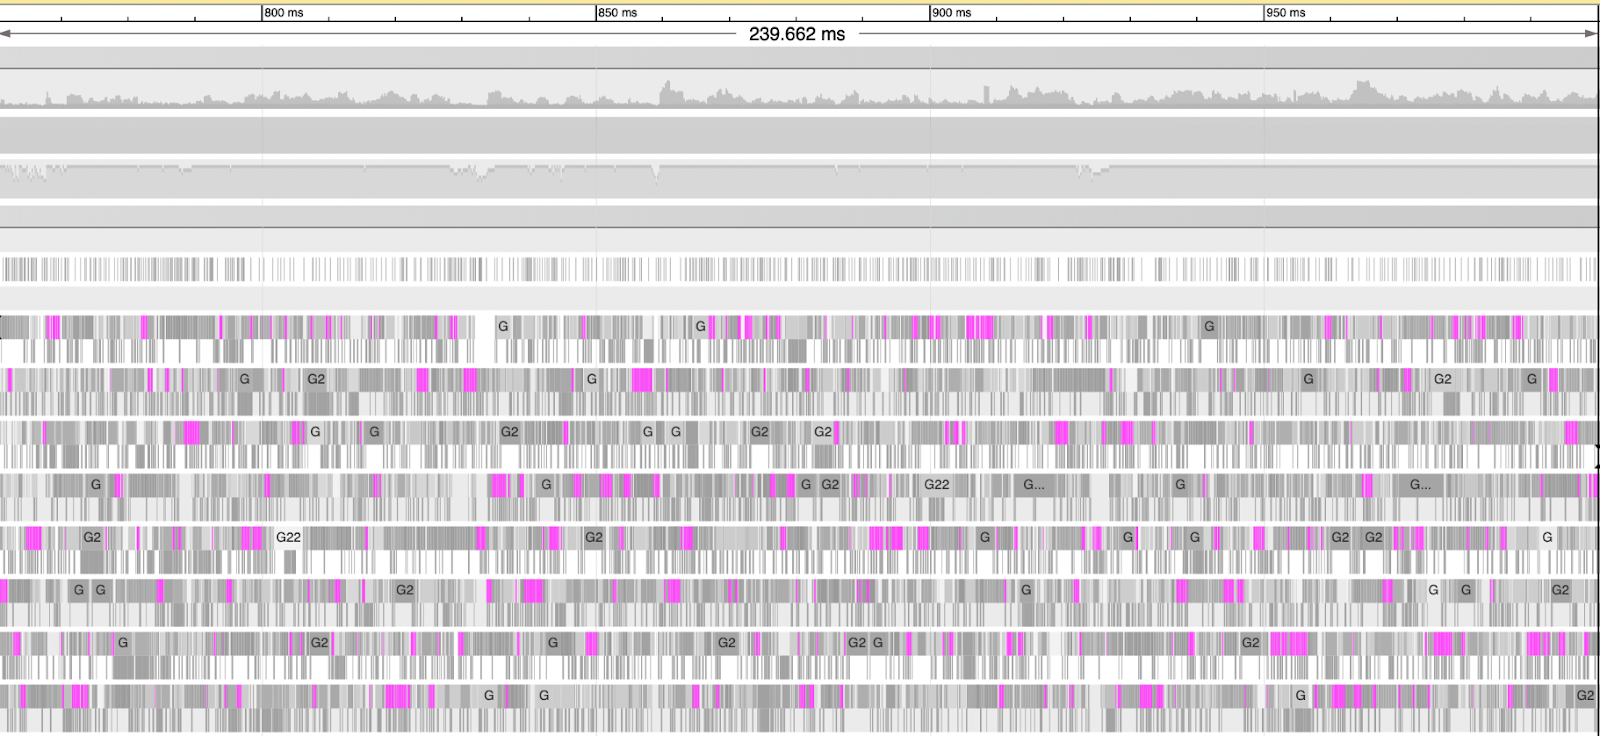
Go scheduler traces showed the following – backup requests were long running chunks with no clear affinity to specific cores, which was somewhat surprising (to this author at least).
Go scheduler trace showing non-affine and (relatively) chunky backup work being processed.
Figure 5. Go scheduler trace showing non-affine and (relatively) chunky backup work being processed.Was it possible that the averaging of runnable goroutines across processors was
hiding goroutine buildup only on certain cores? Go’s runtime exports a
/sched/latencies:seconds histogram (introduced after we developed the
runnable g’s-per-p metric described above), which directly captures the latency
distribution of goroutines waiting for the scheduler to run them. It showed a
striking correlation:
End-to-end latency being highly correlated with scheduling latency, but with a multiplier.
Figure 6. End-to-end latency being highly correlated with scheduling latency, but with a multiplier.Had we found our cause? The optimist in me believed we had but my colleagues forced more legwork. With modifications to our RPC layer and re-running with a patched Go that tracked the runnable nanos observed by each goroutine (fear not! later we’ll talk about a more exciting, not-for-debugging-only patch to the runtime), we were able to observe directly in traces how much runnable time was observed by RPC handling goroutines. The previously unaccounted for time was in fact due to CPU scheduling latency.
2.3.1 The Tail at Microscale
How do we reason about the 22x amplification between p99s of scheduling and foreground request latency? Despite having forgotten all college math to answer definitively, one (likely incorrect but confident) intuition is the following: because we straddle multiple goroutines at the request level, we’re subject to a sequence of scheduling latency events with some probability distribution. We should expect high percentiles at the scheduling latency level to appear at lower percentiles at the request level. When resorting to latency simulation, we see the following:
// ... serial-p0.91=1s serial-p99=1m0.009s (vars=10)Here we’re calculating the latency profile of a request that straddles
multiple goroutines (=10 in this example) with a fixed scheduling latency
profile (p99=1s, p99.9=1m; ignore the unrealistic magnitudes, they’re there
to make it easy to track effects). Both (1) and (2) below show the same effect
— that higher percentiles of any latency variable a request depends on in
sequence shows up at a lower percentile for the request itself.
serial-p99=1m0.009sshows that thep99of this request ends up observing a higher percentile (p99.9) of the Go scheduler latency.serial-p0.91=1sshows that thep99=1sof the Go scheduler latency shows up at a lower percentile of the request (p91).
Given the results above, one takeaway is to be conscious of the number of goroutine/thread handoffs performed in the synchronous path of latency-sensitive requests. And also that it’s important to measure CPU scheduling latencies explicitly.
3. Feedback control for elastic work
So scheduling latencies increase non-linearly with CPU utilization (including
by elastic work), an increase which in turn affects foreground latencies.
Looking back at the scheduler traces from earlier, it’s not just that
individual cores are busy not doing foreground work, it’s that we’re
consuming too much CPU time in aggregate (semi-frequent calls to
runtime.Gosched() during elastic work didn’t help). When reducing aggregate
elastic CPU use by lowering rate limits or injecting time.Sleep()s in elastic
work, we improve both latencies. We have two questions:
- What CPU % should be used for elastic work?
- How do we enforce a given CPU % for elastic work?
Scheduler trace when backup work frequently yields itself.
Figure 7. Scheduler trace when backup work frequently yields itself.We half-entertained ideas about pinning goroutines doing elastic work to
specific OS threads and using kernel scheduler facilities to nice them down.
But we wanted to see how far pure-Go, in-process control could take us first
without involving the OS. This scheme is described below; there are two
components in play: a feedback controller to determine a CPU % for elastic work
and a token bucket to enforce the determined CPU %. To power the latter we made
use of an innocuous patch to the Go runtime, which is also described below.
3.1 Clamping down on scheduler latencies
To isolate foreground latency from elastic work, we only want to admit elastic work provided scheduling latencies are acceptably low. Experimentally, we’ve found a scheduling p99 latency of 1ms to work ok for stock workloads. We continuously determine the right elastic CPU % allotment using a feedback controller that makes step adjustments while measuring scheduling latencies. If over the latency target, the % is reduced until some floor (to prevent starvation); if under the target and we have elastic work waiting for CPU, the % is increased. Unused CPU % is slowly decayed to reduce likelihood of (temporary) over admission. We generally adjust down a bit more aggressively than adjusting up due to the nature of the work being paced — we care more about quickly introducing a ceiling rather than staying near it (though experimentally we’re able to stay near it just fine). The adjustments are small to reduce {over,under}-shoot and controller instability at the cost of being somewhat dampened.
We use a relatively long duration for measuring scheduler latency data; since
the p99 is computed off of the /sched/latencies:seconds histogram, we saw a
lot more jaggedness when computing p99s off of a smaller set of scheduler
events (last 50ms for ex.) compared to a larger set (last 2500ms). This further
dampens the controller response but assuming a stable-ish foreground CPU load
against a node, it works fine. We do not segment scheduling latencies observed
by foreground and elastic work, we assume that scheduling delays are felt
proportionally by foreground/elastic work by the number of goroutines in each
segment.
3.2 Disbursing CPU tokens
To enforce the CPU % determined above for all elastic work, we introduced a token bucket that hands out slices of CPU time where the maximum amount handed out is determined by the CPU % it’s looking to enforce. On a 8vCPU machine, if limiting to 50% CPU, the token bucket at most hands out .50 * 8 = 4 seconds of CPU time per (wall time) second. There’s no burst capacity; the maximum tokens held by the bucket is equal to its fill rate (4 seconds in our example).
3.3 Integrated, cooperative scheduling
Elastic work acquires these tokens before doing CPU work, blocking until they become available. We’re assuming that:
- The work being paced exhibits little to no blocking behavior (on latches, IO, etc.), or at least has a near-constant non-blocking:blocking ratio (CPU:IO for example) over time.
- We’re not holding latches or locks that affect foreground traffic at the point of admission where we might be subject to admission queuing.
We found that 100ms token grants work well enough in practice. A larger value, say 250ms, would translate to less preemption and fewer round trips (each acquiring tokens for remaining/preempted work). What’s important is that it isn’t “too much”, like 2s of CPU time, since that would let a single request hog a core potentially for 2s and allow for a large build up of a runnable goroutines (mostly serving foreground traffic) on that core, affecting scheduling/foreground latencies.
The work preempts itself once the slice is used up as a form of cooperative scheduling. We make the observation that CPU-heavy work typically has some tight loop within. Within CockroachDB a subset of these can be resumed by clients using resumption keys – so once preempted we return with a resumption key for the caller to re-issue requests that re-acquire CPU tokens. We expose the following API to be invoked in tight loops:
// OverLimit is used to check whether we're over the allotted CPU slice. It
// also returns the absolute time difference between how long we ran for
// and what was allotted. Integrated callers are expected to invoke this in
// tight loops (we assume most callers are CPU-intensive and thus have
// tight loops somewhere) and bail once done. Since this is invoked in
// tight loops where we're sensitive to per-iteration overhead, we
// internally estimate how many iterations at the caller corresponds to 1ms
// of on-cpu time, and only do the expensive checks only once every
// millisecond. It's fine to be slightly over limit since we adjust for it
// elsewhere by penalizing subsequent waiters (using the returned
// difference).
func (h *ElasticHandle) OverLimit() (overLimit bool, diff time.Duration)
For requests that have to run to completion, we provide an automatic pacer that internally re-acquires CPU tokens over time.
// Pacer is used in tight loops (CPU-bound) for non-preemptible elastic
// work. Callers are expected to invoke Pace() every loop iteration and
// Close() once done. Internally this type integrates with elastic CPU work
// queue, acquiring tokens for the CPU work being done, and blocking if
// tokens are unavailable. This allows for a form of cooperative scheduling
// with elastic CPU token granters.
type Pacer struct
func (p *Pacer) Pace(ctx context.Context) error { ... }
3.4 Tracking on-CPU time per goroutine
The runtime maintains a type g struct for every goroutine, and the scheduler
is responsible for transitioning each one through various states. _Grunning
is one we’re interested in, which indicates that the goroutine may execute user
(i.e. CockroachDB) code. The goroutine is also assigned to an OS thread (type
m struct) that is in turn assigned to a CPU core (type p struct). At the
point where a g transitions in and out of the _Grunning state, we maintain
per-g counters that capture the wall time spent in that state.
So how do we measure aggregate CPU use by some set of goroutines? How does each goroutine know that it’s used up its allotted CPU time? Since we’re pursuing in-process control within Go, the simplest thing to do was to patch Go itself. This is something we hope makes its way upstream, but even if it doesn’t, we hope to have demonstrated its utility for high-performance systems like CockroachDB. The primitive we’re after is roughly the following:
package grunning

// Time returns the time spent by the current goroutine in the running
// state.
func Time() time.Duration
With it we’re able to measure aggregate CPU time used across multiple goroutines and also have each goroutine be acutely aware of its own use. The actual patch in question is delightfully small and is being used in CockroachDB releases going forward. It also has other possible uses around load attribution for replica/lease placement, or surfacing per-statement cluster-wide CPU use – details we encourage readers to learn about through the accompanying RFC. Aside: our adoption of Bazel (something we hope to write about soon) is what made it practically feasible to run patched language runtimes across development, CI and production environments.
It might be that it’s hard to keep scheduling latency at very low levels while
achieving reasonable high aggregate CPU utilization in the presence of elastic
work (due to uneven queueing of runnable gs at ps perhaps). In case this
starts becoming a problem, we’ve considered more invasive
changes to the goroutine
scheduler by introducing a lower priority class of ‘elastic’ goroutines to
drive higher CPU utilization with lower foreground goroutine scheduling impact.
If anything, such prototypes help us understand how far we can improve things
even if not productionized.
It’s worth noting that this technique of using measured on-CPU time for in-process CPU % limiting is something the runtime does internally for GC work, which is capped at 25%. We hope to further push on this idea of in-process CPU control. Wouldn’t it be cool to be able to soft-cap a certain tenant/workload on a given machine to some fixed % of CPU? There are some caveats with this form of CPU-tracking – time spent by goroutine on a thread descheduled by the OS (in favor of non-CockroachDB processes running on the same node for example) is invisible to the Go runtime, and as such, the patch above can inaccurately count this off-CPU time towards the per-goroutine total. But for now we’re ignoring such concerns since sane database deployments don’t typically compete for CPU with other colocated processes. We’ll revisit as we develop better intuitions.
3.5 Experimentation and analysis
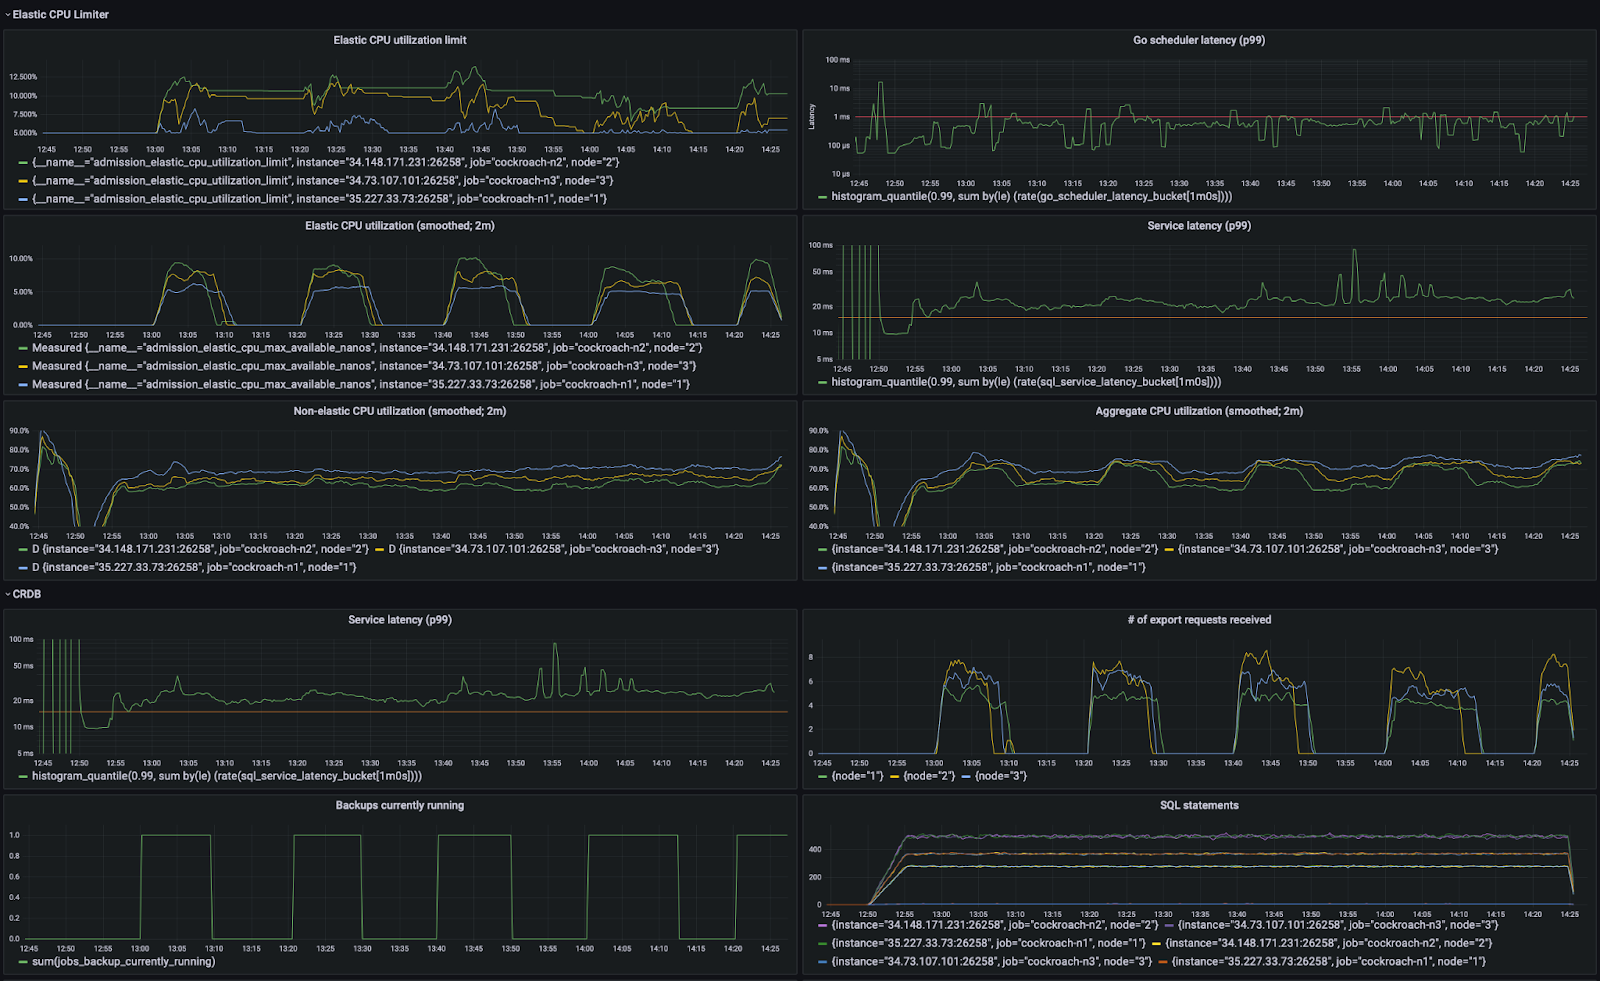
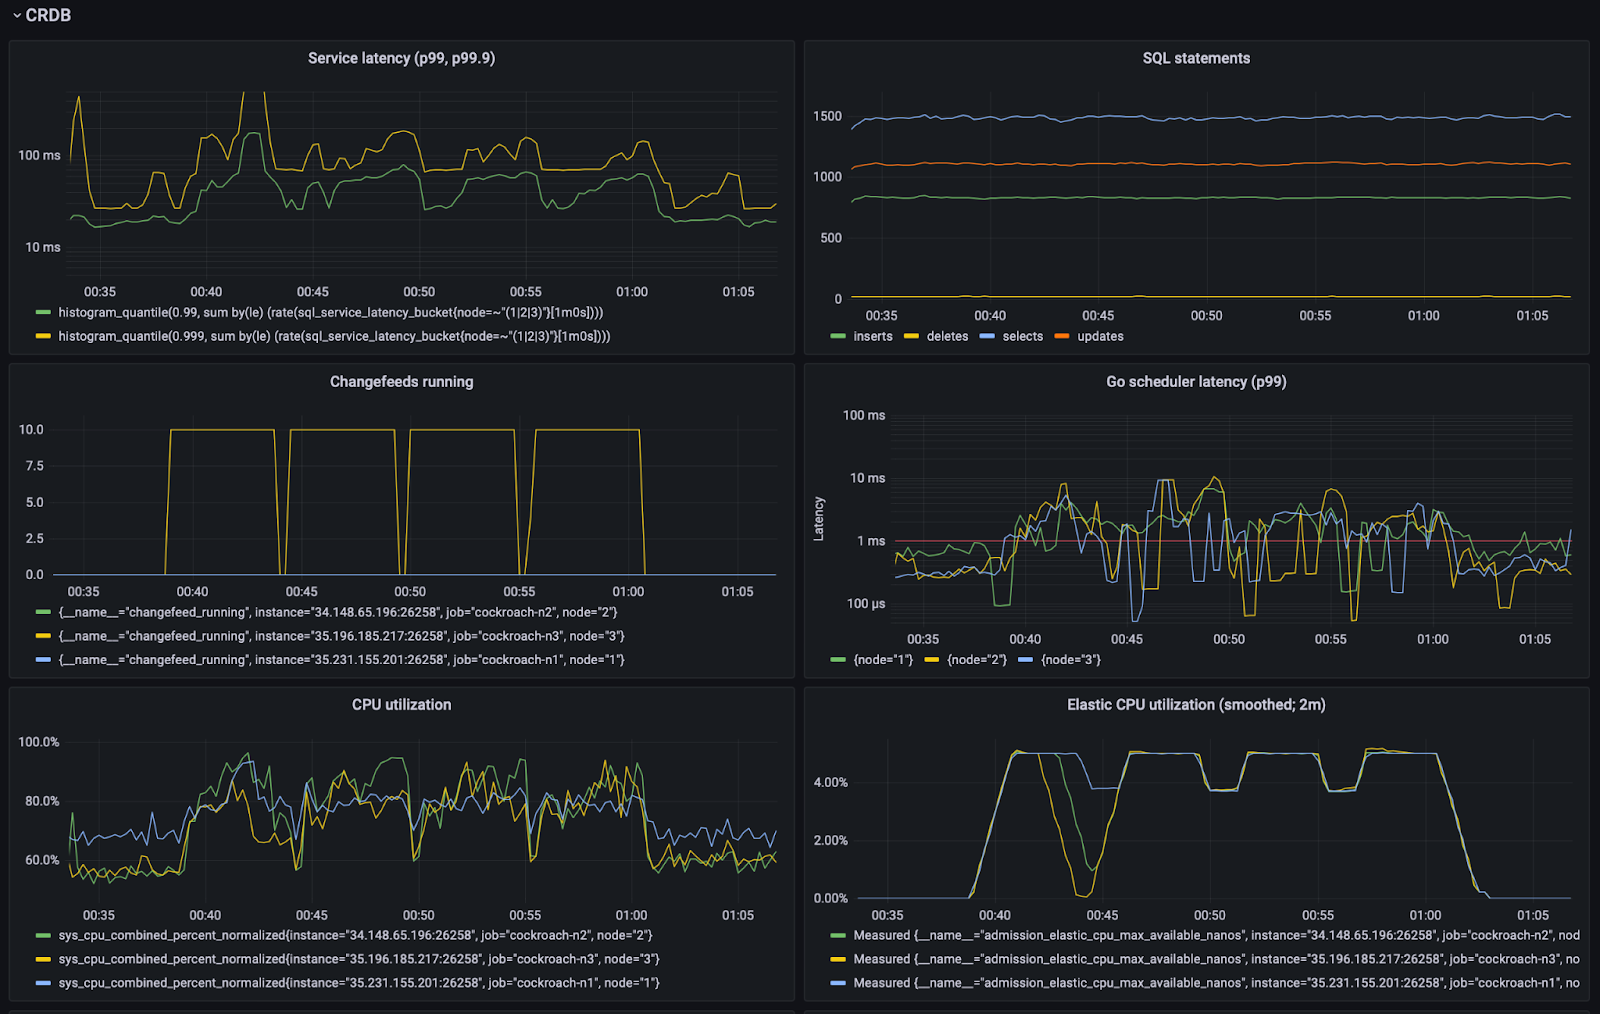
The graphs below show this in action. We’re running backups every 20m, each taking ~5m, against a 3-node 8vCPU cluster running TPC-C with 1000 warehouses. The first graph shows the elastic CPU limit being set dynamically (in this run between min and max values of 5% and 75%, respectively) and the first graph on the right column shows how it constantly tries to keep scheduling latencies under some target (1ms at p99), and is able to. The effects on end-to-end SQL latency and aggregate CPU utilization are also shown. The second graph in the left column shows bursty elastic work that is able to use only as much CPU as allotted, and is able to adapt to differences in per-node CPU headroom. In the first part of the graph we see that n2 (green line) is using less CPU for foreground work (third graph in the first column, green is ~63% while other nodes are closer to 70%), so is able to use more CPU for elastic work – it has a higher elastic CPU limit and higher elastic utilization. This is entirely due to differences in foreground load across the nodes, something the controller is able to adjust to automatically. Since we’re not CPU saturated, the utilization observed by non-elastic work is flat (third graph in the first column). The periods where there is some elastic work happening is when the elastic CPU limits see change.
Elastic CPU control applied to backups on 3-node 8vCPU cluster running TPC-C with 1000 warehouses.
Figure 8. Elastic CPU control applied to backups on 3-node 8vCPU cluster running TPC-C with 1000 warehouses.We also added another integration of this elastic CPU controller. CockroachDB has this internal primitive we call rangefeeds – it lets one subscribe to incremental updates over some keyspan starting from some timestamp (this is what powers much of our CDC machinery). When setting up a rangefeed, it’s also possible to run a ‘catchup-scan’, a scan of all data in the keyspan after which the incremental phase starts. Similar to what we saw with backups, this scan-heavy nature is CPU-dominant and can affect foreground latencies. When integrating it with the elastic CPU limiter, we observed the following:
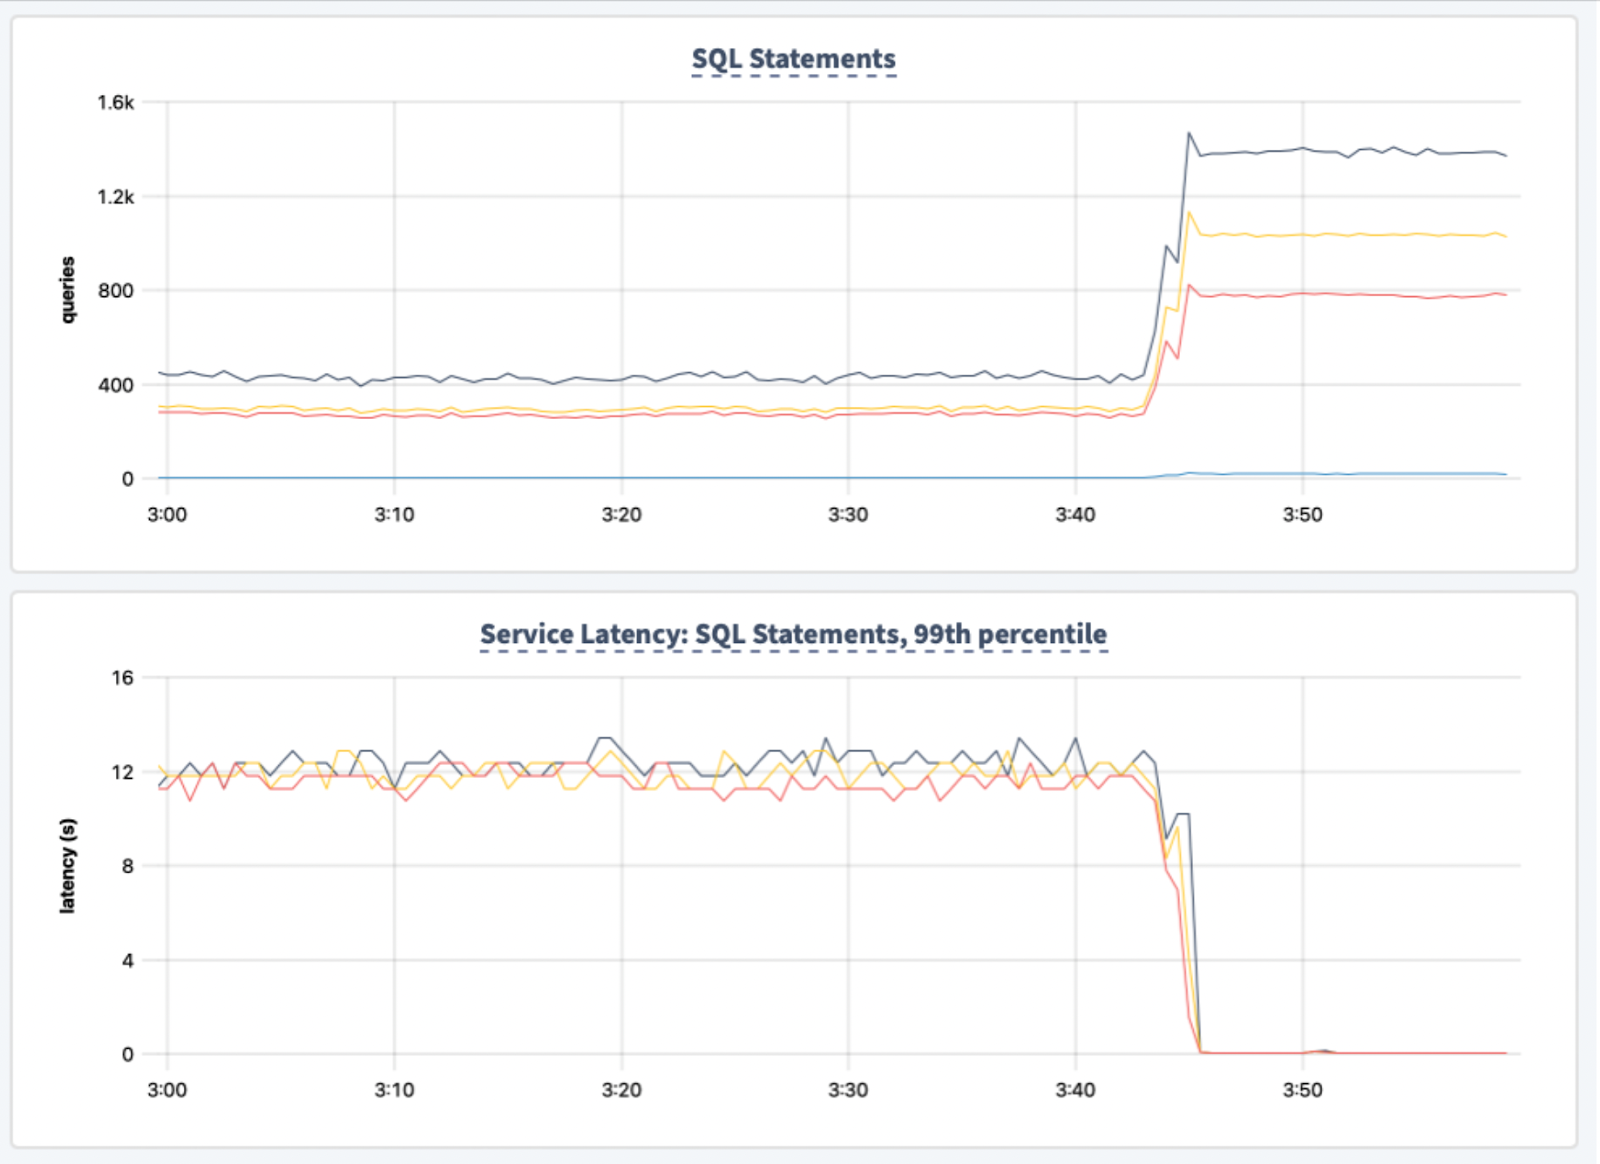
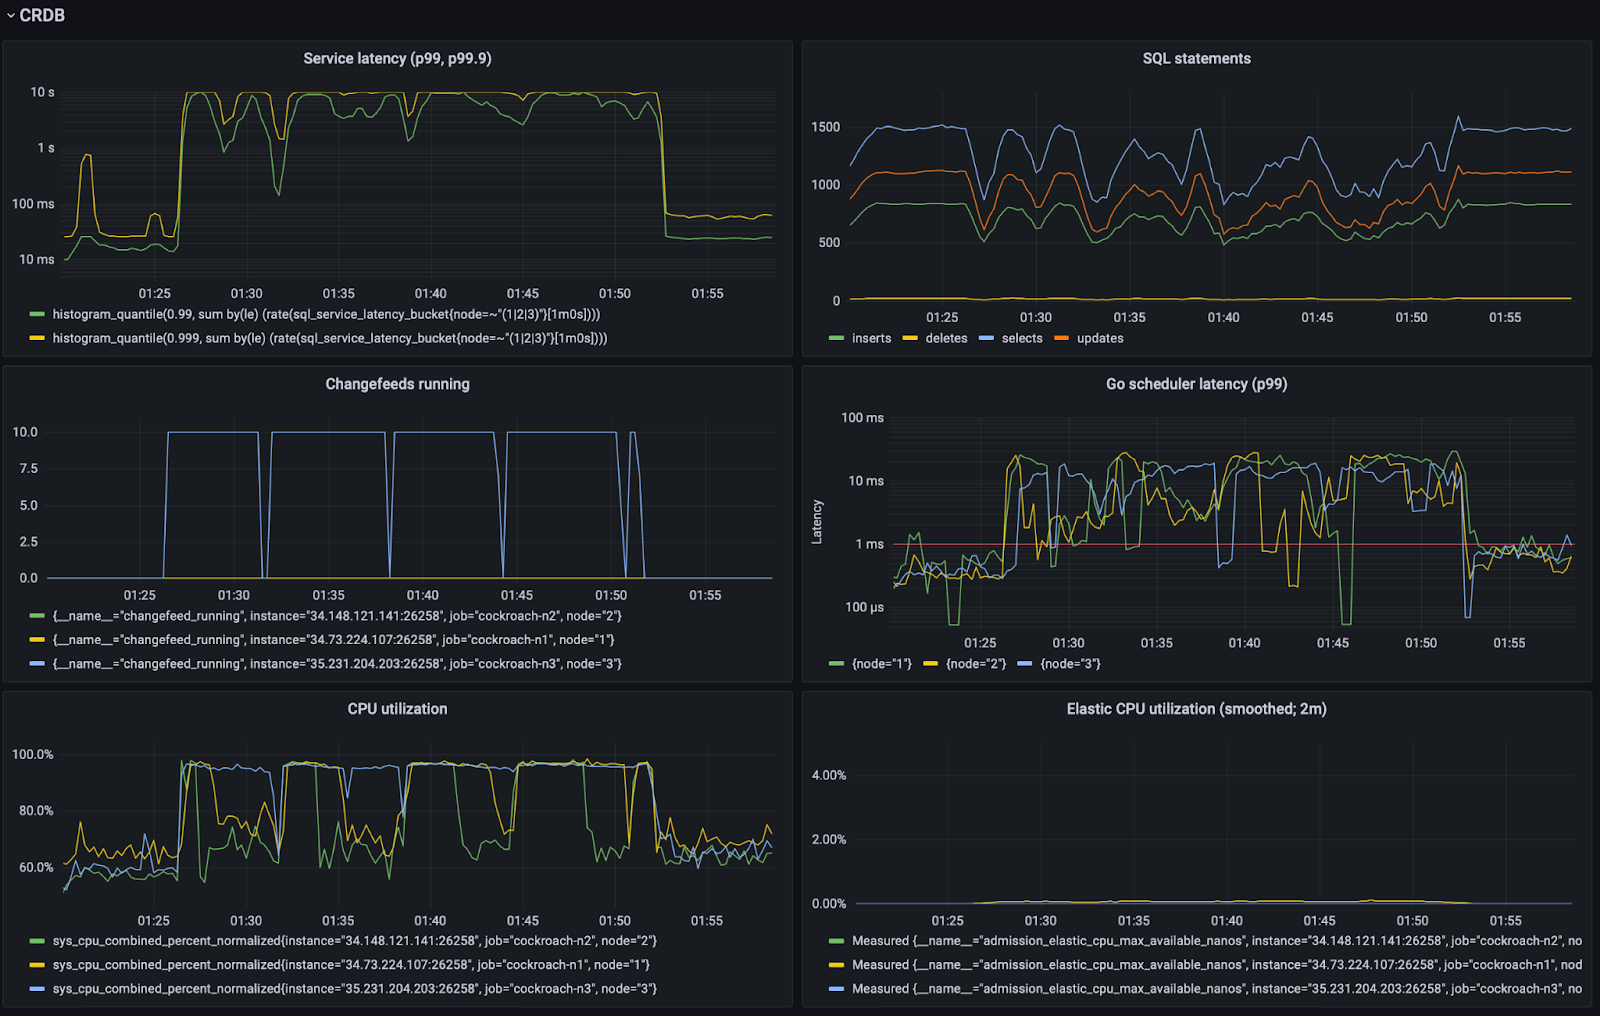
Before (first figure) there’s a lack of throughput isolation, very poor latency isolation – p99 latency hits 10+s. Afterwards we have throughput isolation, ok latency isolation – p99 latency is 60ms.
Figure 9. Before (first figure) there’s a lack of throughput isolation, very poor latency isolation – p99 latency hits 10+s. Afterwards we have throughput isolation, ok latency isolation – p99 latency is 60ms.When evaluating the controller we ran various experiments to understand its transient and steady-state responses. In these experiments (too numerous to show here) we set the initial elastic CPU % to be (i) too high, (ii) too low, and observed how quickly the right % was found. We also tried variants where the foreground CPU demand was drastically (i) increased, and (ii) decreased to see whether the controller would permit less and more elastic work in respectively. We also verified that it was effective in the face of resource and/or load heterogeneity, showing that differently {provisioned,cgroup-limited} nodes with non-uniform load independently found the right elastic CPU utilization levels.
4. Summary
We found this scheme to be effective in clamping down on scheduling latency that’s due an excessive amount of elastic work, which in turn protects foreground latency. We emphasize the orientation around scheduling latency and control granularity that is to be had by disbursing granular tokens representing CPU time. Finally, we talked about the Go runtime changes needed to power this machinery. Thanks for reading!


